Please have in mind when you compare the Zeiss and Canon articles about MTF that they have a different approach to the subject. Zeiss exhibits achievments from the real world lenses, while Canon exhibits design ideals for each lens.
Understanding the MTF graph A text about MTF from Canon's Lens Technical Reports
Please have in mind when you compare the Zeiss and Canon articles about MTF that they have a different approach to the subject. Zeiss exhibits achievments from the real world lenses, while Canon exhibits design ideals for each lens. MTF stands for Modular Transfer Function. It is one method of evaluating lens performance based on the contrast ratio. The MTF indicates how well the lens can reproduce a likeness of a subject on film. It is expressed as a frequency characteristic. For optics, the frequency is expressed as a spatial frequency, which is the number of lines per millimeter of a sine wave pattern whose complexity varies according to the sine waveforms. Normally, a low spatial frequency indicates good contrast and a high spatial frequency indicates good resolving power.
The perfect optical system would not reduce the contrast of a subject as recorded on film. However, since there are always residual aberrations, a reduction in contrast is unavoidable. The MTF graphs indicate how much the lens reduces the contrast. The MTF graph's horizontal axis represents the distance (mm) along the diagonal extent from the center of the picture. "0" is the center of the picture and 21.6 (mm) is the corner of the picture. The vertical axis is the contrast, with "1" indicating zero reduction (impossible) of contrast. The black curves are the results for the tests taken at the lens' maximum aperture, and the blue curves are the results for f/8. The solid line curve were obtained with a sagital (S) target, while the broken line curves were obtained with a meridional (M) target. The bold curves are for 10 lines/mm spatial frequency and the hair-line curves are for 30 lines/mm spatial frequency.
How to analyze the MTF graph: the higher the MTF curves are on the graph (the closer the MTF curves are to "1" on the contrast axis), the higher the contrast and resolving power. Normally, if the MTF curves for 10 lines/mm are 0.8 or higher, the lens is superior. If they are between 0.6 and 0.8 the lens can be considered adequate for good image quality. Also, the closer the sagital and meridional curves match, the lower the astigmatism and the better the background blur. Bear in mind that the MTF curves of a lens should only be compared to those of a lens with an identical or similar focal length. Also, lens selection should not be based entirely on MTF curves. Other factors such as size, weight, and price should also be considered.
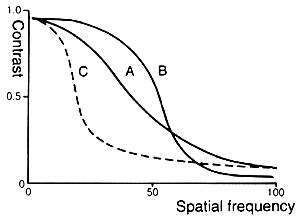
Sample MTF contrast Sptaial Frequency
A: Indicates good resolving power and good contrast.
B: Indicates good contrast but poor resolving power.
C: Indicates good resolving pewer but poor contrast.

