There are different ways to achieve sharper pictures. One of them is to choose a large format film, another is to simply use a sharper lens. In this article I will try to explain what a modulation transfer function (MTF) is and the difference between sharpness and contrast. I will also explain how an MTF test graph should be interpreted.
Resolution, contrast, MTF By Lars Kjellberg
There are different ways to achieve sharper pictures. One of them is to choose a large format film, another is to simply use a sharper lens. In this article I will try to explain what a modulation transfer function (MTF) is and the difference between sharpness and contrast. I will also explain how an MTF test graph should be interpreted. The terms sharpness, resolution, contrast, brilliance and MTF are legion and not always easy to differentiate. What is the difference between sharpness and contrast? At first glance this seems an elementary question. Sharpness is how well-focused or blurred our pictures are, contrast is a measure of how great the difference is between their lightest and darkest parts. Think about it further though, and you will find that this description is incomplete. It all depends on what you intend to depict. Sharpness and resolution are two ways of expressing the same thing. Brilliance is a word that pops up here and there, although what is meant by it is more doubtful. MTF stands for Modulation Transfer Function and will be explained in detail in this article.
The object
Taking a picture of an object with a completely black or completely white surface is not difficult. It can be done using the bottom of a bottle as a lens. The surface will come out black or white in the picture. But what about the sharpness and the contrast? Well, the sharpness is perfect and the contrast is close to 100%.
But if we imagine photographing a more complicated object, true reproduction immediately becomes more difficult. Imagine an object that consists of black lines on a white background. We want the lines reproduced so that they are 1/2 mm thick on the negative, that is, each millimetre of the negative contains one black line and one white line. We now have a line frequency of one pair of lines per millimetre (1 line-pair/mm, or 1 lp/mm). This will appear sharp even if a simpler lens is used, but how do we judge the contrast? Contrast is the difference in darkness between the black and the white lines. By measuring the difference between a white and a black line on the subject, and comparing this to the contrast in the picture produced by the lens, we get an idea of how well the lens reproduces contrast for this line frequency.
Now imagine thinner and thinner lines (higher and higher line frequencies) and consider the contrast between the white and black lines. The thinner the lines become, the harder it is for the lens to reproduce them sharply and with an acceptable contrast.
You might well wonder what the point of all this is, since you do not normally take pictures of black lines on a white background! But it is the case that photographic subjects are made up of finer or coarser details that generally are darker or lighter to different degrees. The actual optical part of photography is about projecting finer or coarser details and their different colours and grey tones onto film, and making it look as lifelike as possible.
The pedestrian crossing
Imagine taking a photograph of a pedestrian crossing, consisting of a black, metalled road with wide white lines on it. We photograph this from not too far away and take a look at the negative. We have chosen our distance and focal length so that the black and white stripes will be 2 mm wide on the negative. The contrast between them will be high because even a bad lens is capable of reproducing such broad lines clearly.
But when we look at the white stripes with a loupe we find narrow black cracks in them. These are much finer lines that are a lot more difficult to reproduce with their contrast intact. The white next to the cracks blends in with the black. The contrast between black and white has decreased considerably. This is where we can sift the wheat from the chaff because a low-grade lens cannot handle such fine lines.
When talking about the contrast between such fine lines it is easy to understand that we are also discussing sharpness. The lower contrast with which a simple lens reproduces the lines can also be interpreted as poor sharpness.
From this we can conclude that sharpness and contrast are really the same thing, but with the difference we perceive it as (and call it) contrast when looking at coarser details (low line frequencies), and as sharpness or resolution when we look at finer details (high line frequencies).
Modulation Transfer Function
Put simply, MTF-measurements assess the contrast between black and white lines of differing thickness or line frequency, and give an objective measurement of a lens' performance.
The MTF gives us a measurement of how much contrast remains between white and black lines after they have been projected through a lens. How big was the difference, or contrast, in the original? What percentage of the original contrast is left after projection? If the MTF for a particular line frequency is 0.85, that means that 85% of the original contrast remains after projection. This decrease in contrast does not only affect white and black surfaces; the difference between dark grey and light grey surfaces also decreases by the same percentage.
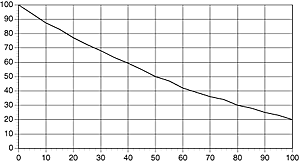
Common to all lenses, regardless of price or quality, is that they all have nearly 100% MTF at very low line frequencies, in other words when coarse details are reproduced. They also all have 0% MTF at very high line frequencies. No photographic lens in the world can reproduce 1000 lp/mm successfully. This means that all lenses start at 100% and end at 0%. The lens' performance in between can be described as a curve.

The X-axis shows the line frequency from zero upwards. The further along the x-axis you go, the finer the detail. The Y-axis shows the MTF from 0 to 100 per cent. The further up the Y-axis, the better the subject's contrast is reproduced. If the difference in darkness between two surfaces is identical for the original object and the projected image, the MTF is 100%. This is rare. Most of the time you get a slight decrease in the contrast. By measuring the percentage of difference in blackness that remains after projection, you get the MTF-value.
This MTF diagram is not the same as the ones we present when testing lenses. In this diagram we are only looking at a small part of the projected picture, for example the centre of the frame, and give an MTF value for all line frequencies at this point. The diagrams we are presenting along with the tested lenses show the MTF value at three line frequencies but for the entire picture, from the centre (far left on the X-axis) to the corners (furthest right on the X-axis).
Resolution and Contrast
You often hear people make comments like: 'This lens is sharp, but gives a low contrast'; or 'That lens has a high contrast, but it isn't that sharp.' It is not always very clear what they mean. It can be a question of multi-coating. A lens with poor multi-coating can in a certain light, especially in direct light, give a lower contrast without a deterioration in resolution.
But they are probably not talking about multi-coating. In order to perceive a lens as sharp, it does not need to have a particularly high contrast. The most important thing is that it should also be able to reproduce finer details with a tolerable contrast. You only need a contrast of about 20% to be able to read black lettering on a white background. Under 20% things start to become difficult. You can look at an MTF diagram to check the fineness of detail that a certain lens is able to reproduce at 20% MTF. The finer the detail, the better the resolution.
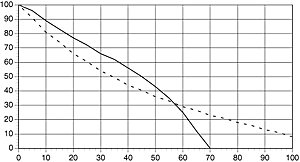
For a lens to be regarded as having good contrast, it will need to have high MTF-values at low line frequencies. It can already be down at zero by 50 lp/mm as long as it has high values before that. Its contrast will be perceived as high, without its resolution being good.

The solid curve represents a lens with high MTF at low line frequenses - a 'contrasty' lens. The dashed curve represents a high resolution lens.
Diffraction
Diffraction is a phenomenon that is connected to the wave properties of light. When a wavefront passes a sharp edge, it is deflected slightly. The diameter of the light beam passing through a lens is limited by the diameter of the aperture. The aperture forms a sharp edge, and the light passing closest to the edge is deflected very slightly. In other words, the edges of the aperture create a certain amount of fuzziness. This is what is called diffraction.
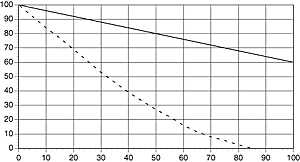
Since it is only the light near to the edges that is deflected and becomes fuzzy, the percentage of 'fuzzy light' decreases when you use a wider aperture. Small holes result in a lot of diffraction. Regardless of how well constructed, well built, or expensive a lens may be, it can never be better than the diffraction limit.

The solid curve represents the diffraction limit at f5,6. The dashed curve represents the diffraction limit at f22.
If you only consider diffraction effects, the MTF automatically becomes lower when a smaller aperture is used. Above all, the MTF of the higher line frequencies is affected most. However, there are other factors involved that affect reproduction. Constructing a lens with a high maximum aperture is much more difficult than constructing one that lets in less light. The high maximum aperture implies a light beam with a large diameter. Because large areas of the lens are used, high demands are placed on it. In practice one sacrifices the MTF in order to gain speed and the MTF values are rarely high when using a fast lens on its widest aperture setting.
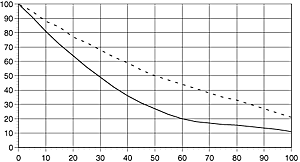
One of the objectives in building a lens from the MTF point of view is to get as close as possible to the diffraction limit. If you look at MTF-curves for different apertures and compare them with the curves for the diffraction limit, as a rule you will find that for wide apertures the MTF-curve is well below the diffraction-limited curve. On the other hand, for small apertures the MTF curve is almost the same as the diffraction curve.
Large apertures mean you end up with only a little diffraction but with large uncorrected optical aberrations, while small apertures produce a lot of diffraction but reduced aberrations. As a rule of thumb a lens is almost always sharpest at apertures between f8 and f11. Large apertures have too many optical problems, and small apertures too much diffraction.

The dashed curve shows MTF for a Schneider Symmar 150 f5,6 lens stopped down to f11. The solid curve shows MTF for the same lens fully opened (f5,6). Stopped down to f22 the MTF curve had been below the diffraction limit for f22 illustrated in Fig 3.
Different reasons for being out of focus
No lens is perfect. To a greater or lesser extent they all have their limitations, and these arise for a number of reasons: Diffraction, spherical aberration, chromatic aberration, coma, astigmatism, etc. When you measure the MTF you will not find out what is causing the problem, and it is questionable whether you, as a photographer, really need to know. What I want to know is how well a given lens can reproduce a certain pattern; how sharp the pictures will be at this aperture or that? MTF measurements give you a good idea. The MTF also gives you a pointer to how well the lens can cope with finer or coarser details. If you want to produce large prints from small negatives, it is useful to know whether the lens is capable of reproducing finer details without blurring them too much. This requires high MTF-values at high line frequencies.
How to interpret our MTF-diagrams
A thorough MTF-measurement for a lens produces reams of raw information. We have distilled this for you.
We have not included diagrams for every line frequency. We have picked three line frequencies which are representative of those most important for photography. The basis for this measurement and the choice of line frequencies is a generally accepted mathematical calculation.
We chose 10, 20 and 40 lp/mm. The most important is 10 lp/mm. This frequency makes up 57% of the total assessment, while 20 lp/mm counts for 29%, and 40 lp/mm 14%.
The curve represents the entire surface area of the picture. On the left of the X-axis is the centre of the frame, and to the right (21 mm for 35 mm lenses) are the corners.
We present six curves for each aperture, two at 10 lp/mm (the top two lines), two at 20 lp/mm (the middle two lines) and two at 40 lp/mm (the bottom two lines). The solid curves corresponds to the sagittal resolution, and the dashed curves corresponds to the tangential resolution. They show how sharp the result will be when the lens reproduces lines crossing the centre (sagittal) and lines that go around the centre (tangential). When the two curves do not coincide - when the MTF is different for the sagittal and tangential directions - this indicates an aberration such as astigmatism. If the difference between the resolutions is large at, say, 15 mm, a sharp dot 15 mm from the centre of the picture will be reproduced as somewhat 'oval', and the image will be more blurred in one direction compared to the other. Normally the two curves should meet in the centre at 0 mm. If they do not the lens is probably not assembled correctly.
We measure the MTF at three different apertures: full (wide open), f4, and f8, but we only present diagrams with curves for full (F) and f8.
Read more about how to interpret our MTF test results in: 'About MTF on our site' (Internet -> photodo -> Photo equipment -> Lenses).
Field Curvature
When constructing a lens you can choose between making the projected image of a planar object also lie in a flat focal plane or of allowing the position where the focus is best to curve outwards as you come away from the lens' central axis. An enlarging or repro lens has to have a planar focal field. This is because such lenses are used solely to reproduce flat objects. Normal camera lenses, on the other hand, are almost always used to photograph three-dimensional objects, and we have less need for a perfectly flat focal field. If the lens designer is allowed to relax this condition we can benefit in other ways. When measuring the MTF of a lens, we set the focus in the middle of the frame and measure the MTF all the way to the corners of the negative without re-focusing. If the lens has field curvature it will show up in the plots because the MTF drops away from the centre, especially when using wider apertures that have a small depth of field. But the fact that the curve falls does not necessarily mean that the sharpness is worse at the edges. It could just as well be that the optimal focus there is for objects further away from or closer to the lens, something that is of no major importance when reproducing three-dimensional objects.
Distortion
In practical terms, distortion means that the reproduction scale is not the same for the whole picture. If a straight line is depicted that ends up out on the edges of a picture, it will no longer be straight after it has been projected through a lens. It can bend either inwards and outwards. If it bends outwards the distortion is negative. This is also referred to as barreldistortion, in reference to the outward bow on the sides of a barrel. Positive distortion is also called pincushion distortion, because the lines bend inwards.
Medium format and 35 mm
We have chosen to use identical methods to grade lenses of different formats. Although a 6x6 negative does not have to be enlarged as much as a 35 mm negative, we have judged them in the same way. A 35 mm negative is enlarged 1.75 more times than a 6x6 negative. To get the same resolution in the picture, therefore, the spatial frequencies at which the MTF is compared should only be 57% of the spatial frequencies for 35mm lenses.
However, since you obviously expect to get better resolution from a 6x6 negative, we have made the same demands of these lenses.
